Visualizing a Tessellation
A tessellation can be visualized using the Visualization Module (-V). The entities to show can be specified, so as their size, transparency and other properties. The crystals can also be visualized. Advanced visualizations can be realized.
A simple tessellation is used in this tutorial, which is generated using the command
$ neper -T -n 200 -morpho gg -oricrysym cubic -o n200
Note
To reproduce exactly the images below, add the following line to your $HOME/.neperrc file (or to a local configuration file to be loaded with --rcfile):
neper -V -imagesize 800:400
Generating a Tessellation Image
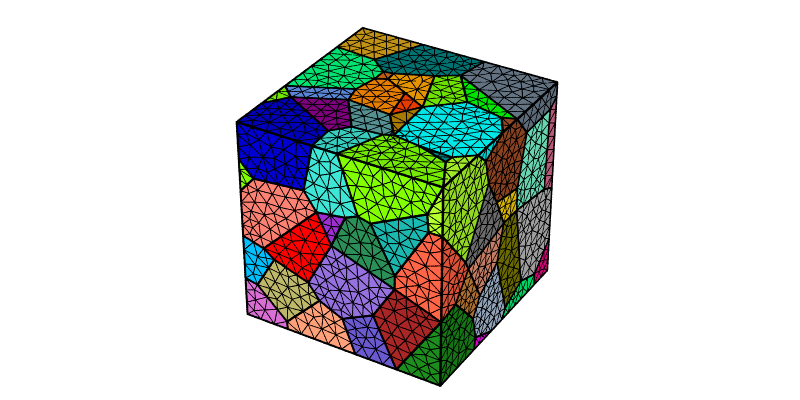
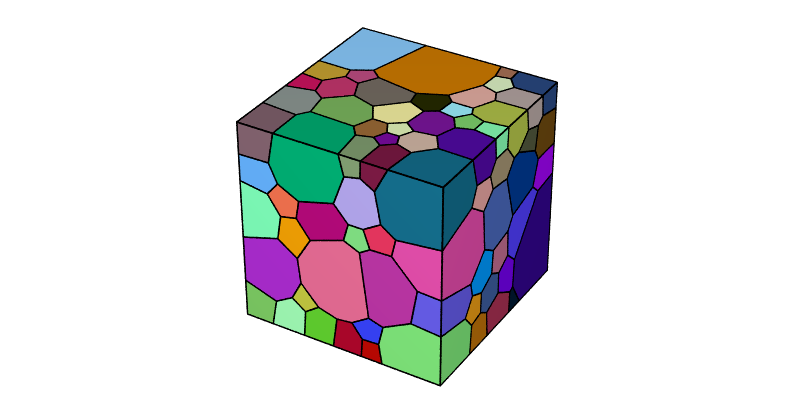
The tessellation can be visualized as follows:
$ neper -V n200.tess -print img1

This generates a PNG image named img1.png. By default, all cells and edges are shown, while other entities are hidden. Cells are colored from their ids and edges appear in black.
Showing Specific Entities
The entities to show can be specified using options -show*, using any logical expression based on the Tessellation Keys as arguments. For instance, only some of the cells can be shown:
$ neper -V n200.tess -showcell "z<0.5" -print img2

By default, only edges that belong to a shown cell are plotted. However, the edges to show can also be specified. For example, to show all of them:
$ neper -V n200.tess -showcell "z<0.5" -showedge all -print img3

The figure is not very clear, and only the domain edges can be added instead:
$ neper -V n200.tess -showcell "z<0.5" -showedge "cell_shown||domtype==1" -print img4

cell_shown (or cell_shown==1) selects edges for which at least one cell is shown, domtype==1 selects edges that belong to a domain edge, and || is the logical OR.
A logical expression can be arbitrarily complex. For example, the following command only shows the cells that have a volume larger than average (0.005, for a 200-cell in a unit cube), have at least 20 faces and are interior to the domain:
$ neper -V n200.tess -showcell "(vol>0.005)&&(facenb>=20)&&(body>0)" -showedge "cell_shown||domtype==1" -print img5
It is also possible to fully hide the cells and visualize the tessellation based on the individual faces, edges, etc.:
$ neper -V n200.tess -showcell none -showface "z<0.5" -showedge "face_shown||domtype==1" -print img6
Faces appear in white by default, but can be assigned colored, as will be covered in the following.
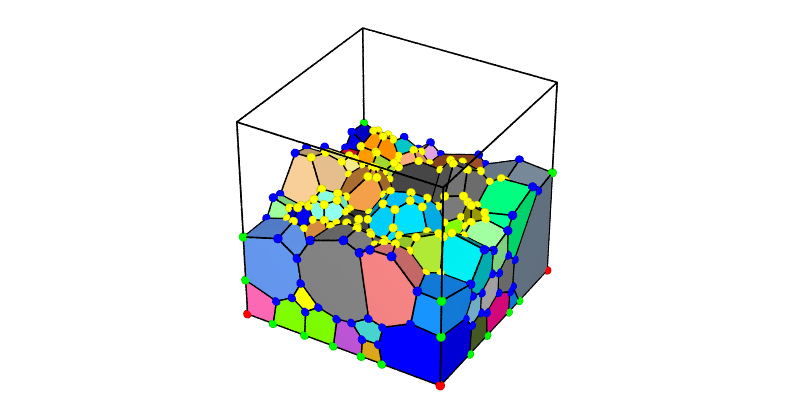
The vertices can also be shown (as before, the domain edges are shown):
$ neper -V n200.tess -showcell none -showedge "domtype==1" -showver all -print img7
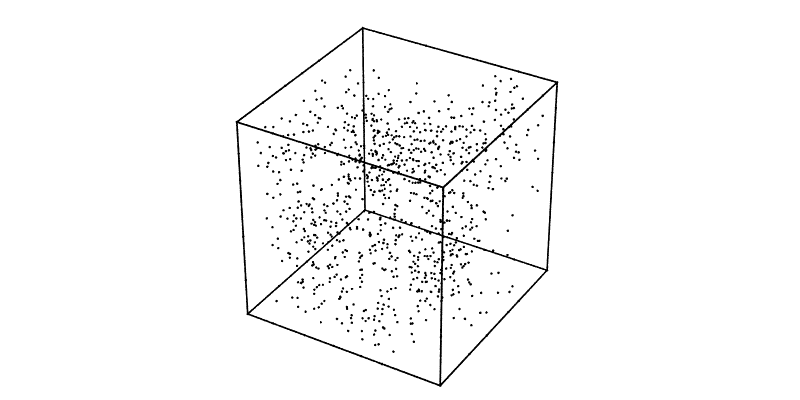
Finally, the crystals can be shown (as before, the domain edges are shown):
$ neper -V n200.tess -showcell none -showcrystal all -showedge "domtype==1" -print img8
By default, crystals are represented based on the cell crystal symmetry (as specified by option -oricrysym), the cell size and the crystal orientations.
Setting Color, Transparency, Size, etc.
The way entities are represented can be specified using options -data*. The entities of a tessellation are the cells (which correspond to polyhedra in 3D and faces in 2D), polyhedra, faces, edges, vertices, seeds and crystals, and their properties include
the color (options -data<entity>col, -data<entity>colscheme and -data<entity>scale and -data<entity>scaletitle),
transparency (option -data<entity>trs) and radius (or size) (option -data<entity>rad).
Similarly to the -show* options, the -data* options can take (mathematical) expressions as argument.
Coloring Cells by Orientations
The following command colors cells by orientation:
$ neper -V n200.tess -datacellcol ori -print img9
Note
The orientation color key itself is not generated but can be obtained as detailed in Plotting an Orientation Color Key (Rodrigues Color Key).
The color scheme can be changed to IPF as follows:
$ neper -V n200.tess -datacellcol ori -datacellcolscheme ipf -print img10
Note
The orientation color key itself is not generated but can be obtained as detailed in Plotting an Orientation Color Key (IPF Color Key).
Coloring Entities from Integer Values
Just like the cell id (id) is used to color cells by default, different integer values can be used, for example the number of faces:
$ neper -V n200.tess -datacellcol int:facenb -print img11
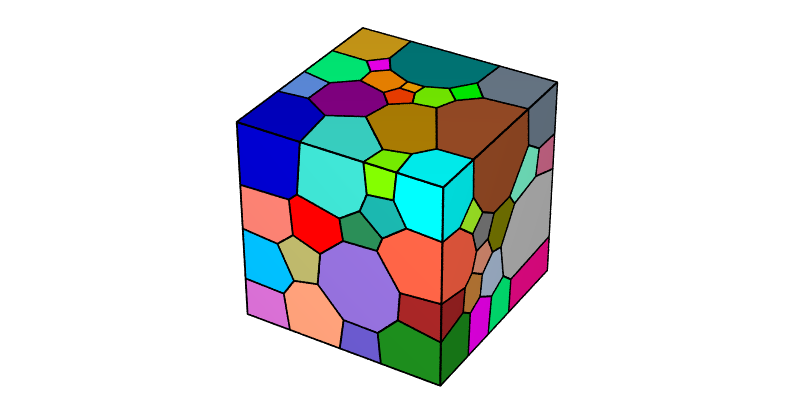
The different integer values are assigned colors using a color palette (see Color Map for Integer Values).
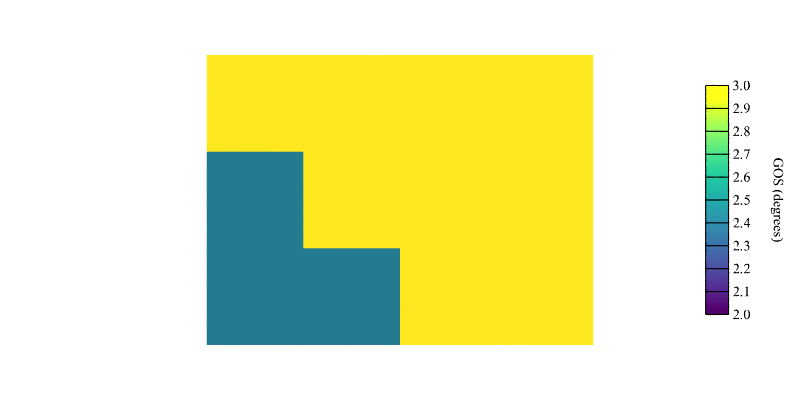
(Mathematical) expressions can be used. For example, Euler’s polyhedron formula, \(V - E + F = 2\), where \(V\), \(E\) and \(F\) are the number of vertices, edges and faces of a cell, respectively, can be verified as follows:
$ neper -V n200.tess -datacellcol int:vernb-edgenb+facenb -print img12
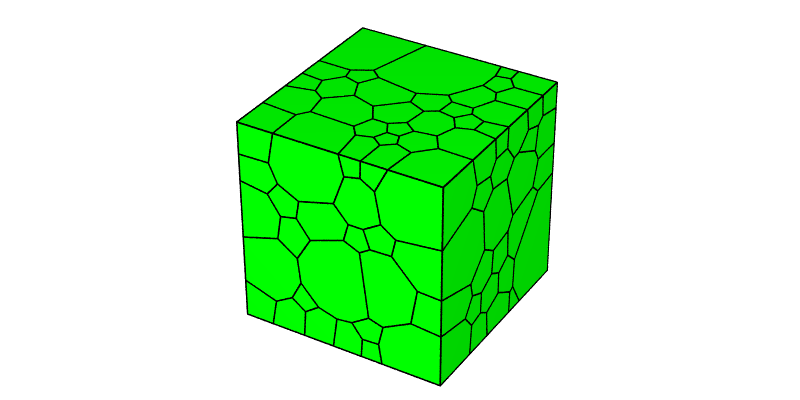
All cells are green, which represents effectively a value of 2 according to the color palette (see Color Map for Integer Values).
Other entities can be colored in the same way. For example, to color the vertices from their cell numbers:
$ neper -V n200.tess -datavercol int:cellnb -dataverrad 0.02 -showcell "z<0.5" -showedge "cell_shown||domtype==1" -showver cell_shown -print img13
The image shows the vertices having 1, 2, 3 and 4 cells in red, green, blue and yellow, respectively.
Note
In options -data*col, the data type may be omitted if it can be determined from the data value, as in -datavercol cellnb.
Coloring Entities from Real Values
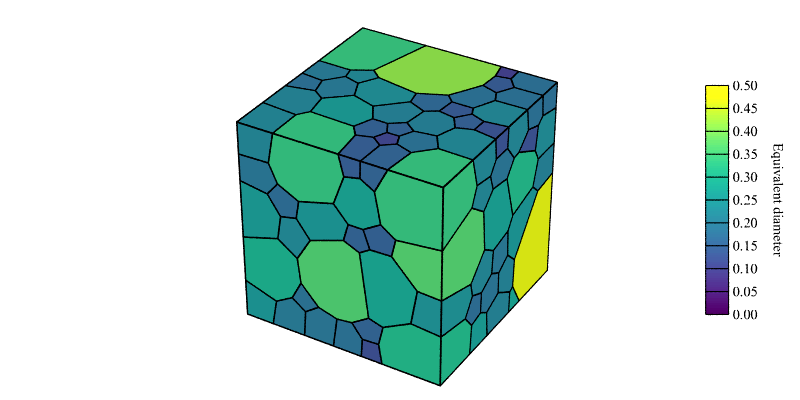
Cells can be colored from real values, for example from the cell equivalent diameters:
$ neper -V n200.tess -datacellcol real:diameq -datacellscale 0.00:0.50 -datacellscaletitle "Equivalent diameter" -print img14
$ convert img14.png img14-scale3.png -gravity East -composite img14.png
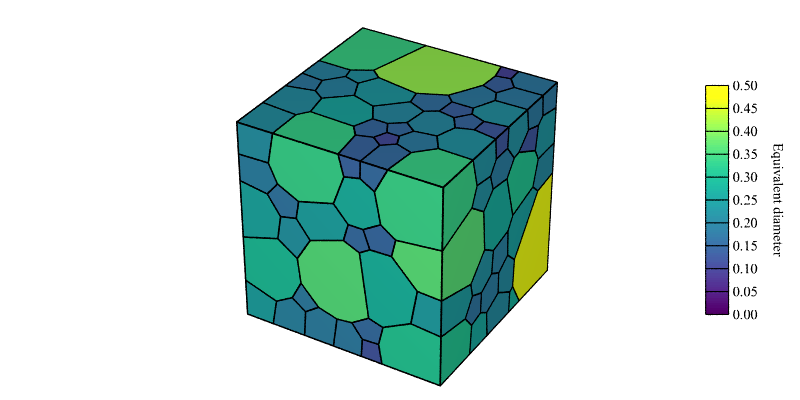
This originally produces a PNG file named img14.png for the map and a PNG file named img14-scale.png for the scale bar, which is included to img14.png thanks to convert.
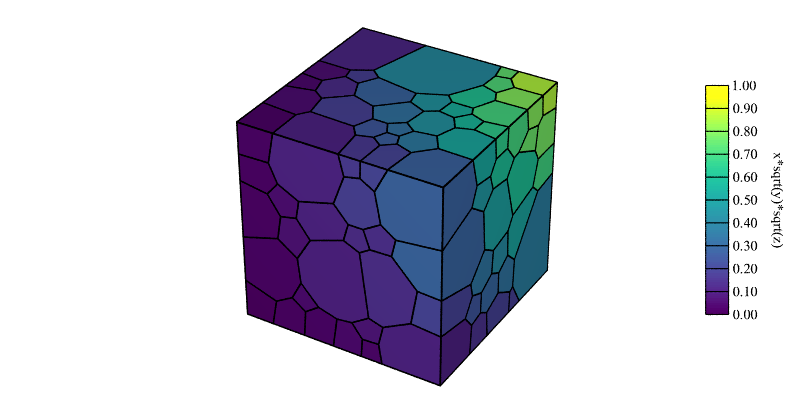
Again, mathematical expressions can be used:
$ neper -V n200.tess -datacellcol "real:x*sqrt(y)*sqrt(z)" -datacellscale 0.00:1.00 -datacellscaletitle "x*sqrt(y)*sqrt(z)" -print img15
$ convert img15.png img15-scale3.png -gravity East -composite img15.png
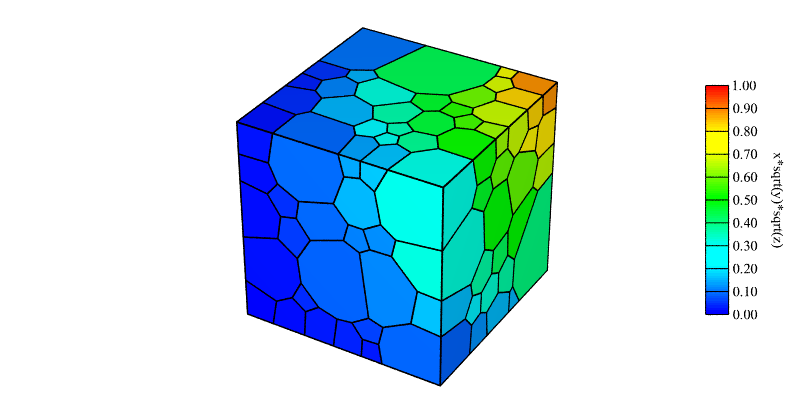
The color key (see Color Maps for Real Values) can be changed using option -datacellcolscheme:
$ neper -V n200.tess -datacellcol "real:x*sqrt(y)*sqrt(z)" -datacellscale 0.00:1.00 -datacellscaletitle "x*sqrt(y)*sqrt(z)" -datacellcolscheme heat -print img16
$ convert img16.png img16-scale3.png -gravity East -composite img16.png
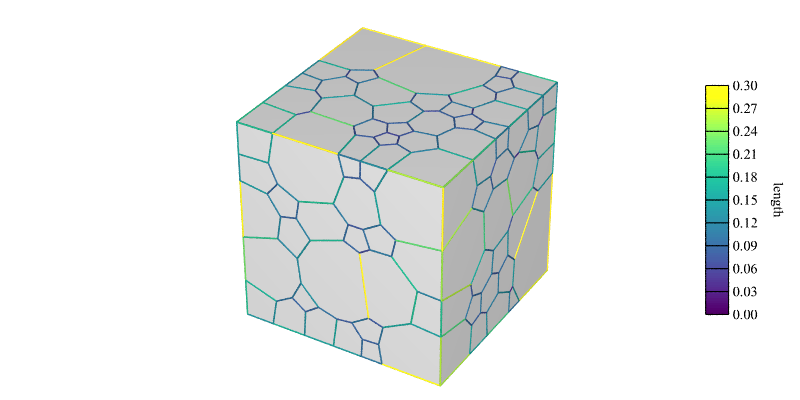
Not only cells can be colored. For example, to color the edges from their lengths:
$ neper -V n200.tess -datacellcol lightgray -dataedgecol length -dataedgescaletitle "length" -dataedgescale 0.00:0.30 -print img17
$ convert img17.png img17-scale1.png -gravity East -composite img17.png
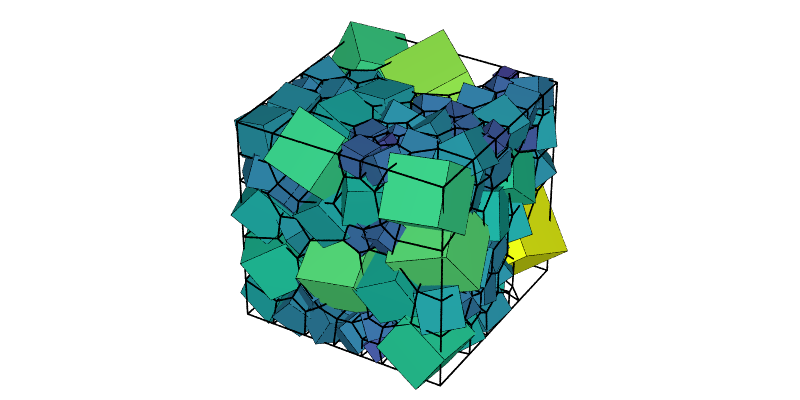
Crystals can be colored, for example, from the cell equivalent diameters:
$ neper -V n200.tess -showcell none -showcrystal all -datacrystalcol real:diameq -datacrystalscale 0.00:0.50 -datacrystalscaletitle "Equivalent diameter" -showedge "domtype==1" -print img18
$ convert img18.png img18-scalec.png -gravity East -composite img18.png
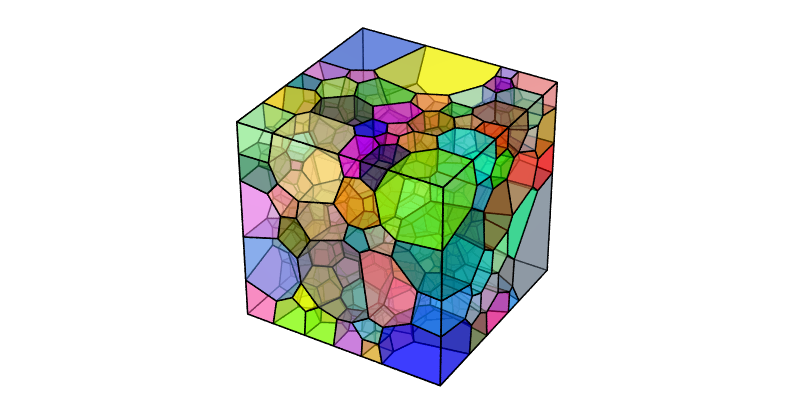
Making Entities Transparent
The transparency level of entities can be specified using options -data<entity>trs. The transparency ranges from 0 (fully opaque) to 1 (fully transparent). The example below uses semi-transparency to show the tessellation interior:
$ neper -V n200.tess -datacelltrs 0.5 -print img19
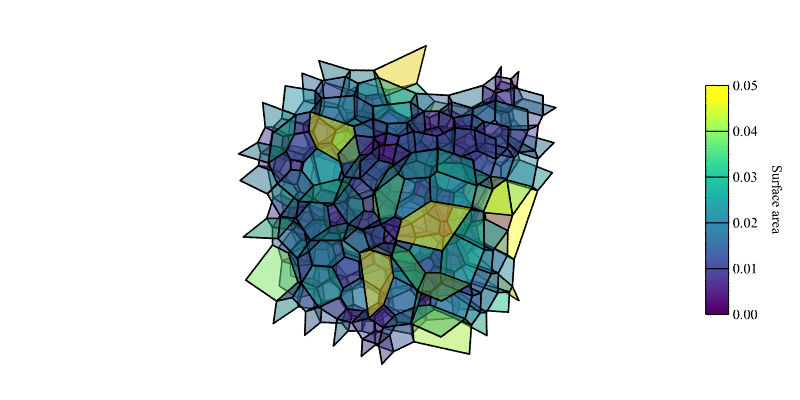
Again, this works for all entities. For example, to show all interior faces colored from their surface areas:
$ neper -V n200.tess -showcell none -showface "domtype==-1" -showedge face_shown -datafacecol area -datafacetrs 0.5 -datafacescale 0.00:0.01:0.02:0.03:0.04:0.05 -datafacescaletitle "Surface area" -print img20
$ convert img20.png img20-scale2.png -gravity East -composite img20.png
Changing the Entity Radius
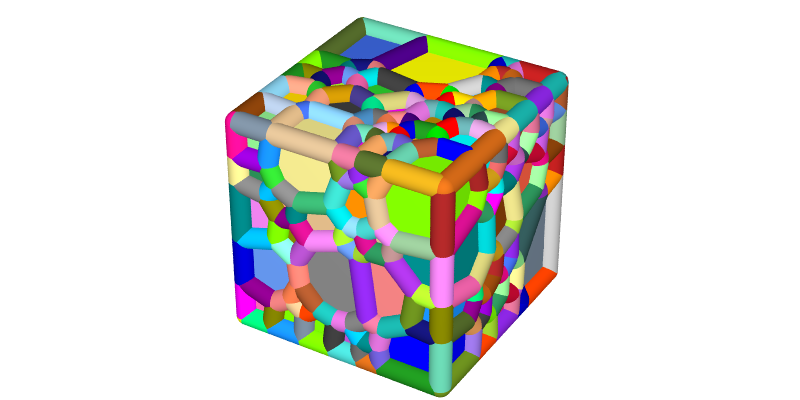
The radius of entities can by modified using options -data<entity>rad, and this works for vertices, edges, seeds and crystals. For example, to plot thick (and colored) edges:
$ neper -V n200.tess -dataedgerad 0.05 -dataedgecol id -print img21
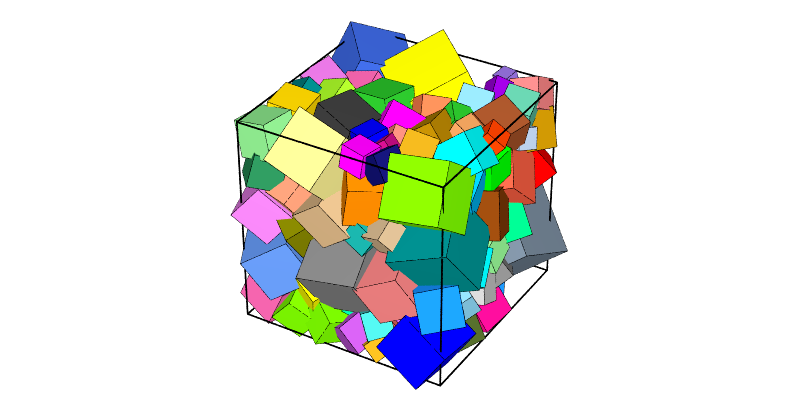
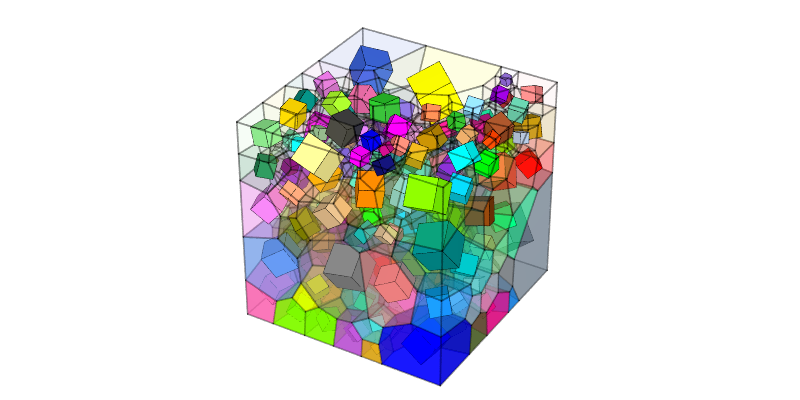
The following command plots small crystals in a tessellation for which cells are made gradually transparent:
$ neper -V n200.tess -showcrystal all -datacrystalrad 0.5*radeq -datacelltrs "sqrt(z)" -dataedgetrs 0.75 -print img22
Changing the General Settings
Neper uses POV-Ray, a ray-tracing software, to generate the PNG images. As such, properties such as the camera position, angle, etc., the type of projection, shadowing effects, etc. can be set.
Camera Settings
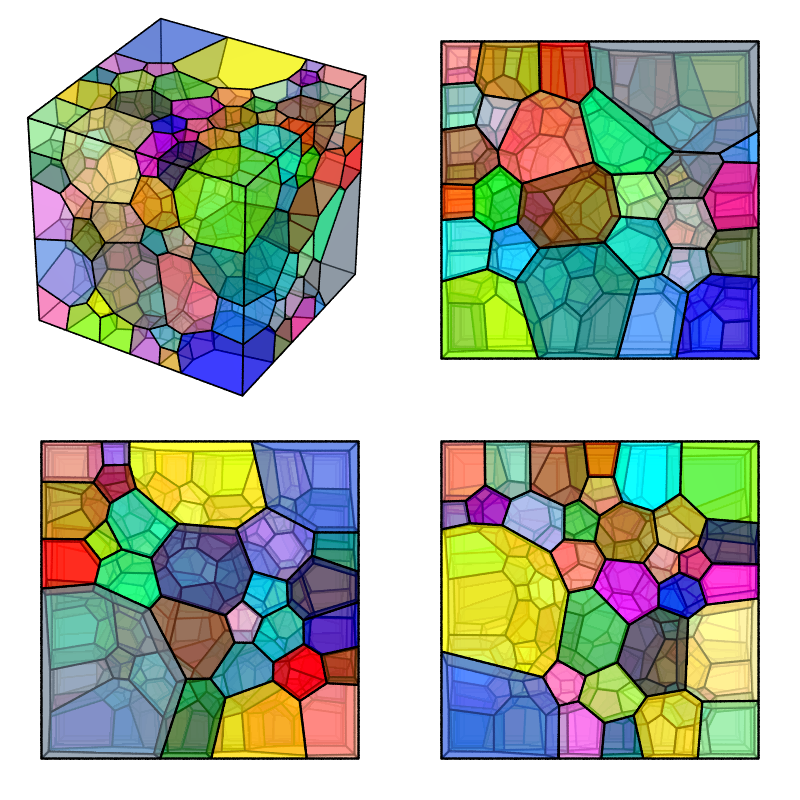
The camera position can be changed using option -cameracoo, for example to produce orthogonal views - option -camerasky may also be needed, to define the vertical direction, and option -cameraangle sets the opening angle along the horizontal direction:
$ neper -V n200.tess -datacelltrs 0.5 -cameraangle 12 -imagesize 400:400 -print view -cameracoo 7:y:z -camerasky 0:1:0 -print xview -cameracoo x:7:z -camerasky 0:0:1 -print yview -cameracoo x:y:7 -camerasky 1:0:0 -print zview
$ convert +append view.png xview.png tmp1.png
$ convert +append yview.png zview.png tmp2.png
$ convert -append tmp1.png tmp2.png img23.png
Note
Several images can be generated in a single Neper command by using option -print several times.
The camera projection type can be specified using option -cameraprojection - in 3D, the default is perspective, but orthographic is also available:
$ neper -V n200.tess -cameraprojection orthographic -print img24
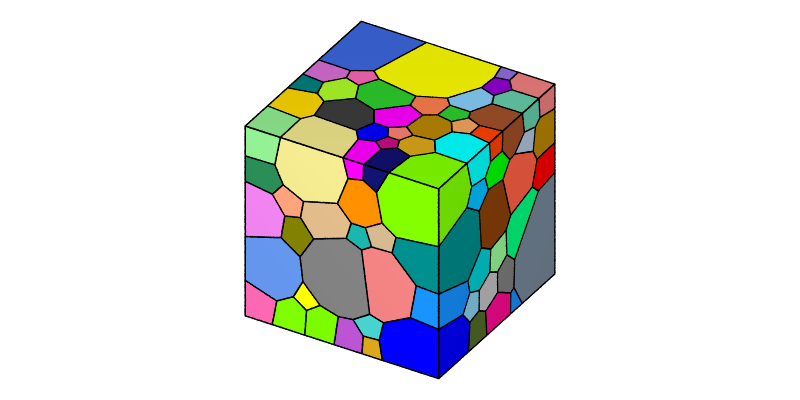
The orthographic projection keeps parallel lines parallel.
Scene Settings
Shadowing can be turned on or off using option -showshadow:
$ neper -V n200.tess -datacellcol real:diameq -datacellscale 0.00:0.50 -datacellscaletitle "Equivalent diameter" -sceneshadow 0 -print img25
$ convert img25.png img25-scale3.png -gravity East -composite img25.png
While shadowing generally improves visualization, turning it off may be useful to render “true” colors, which closely match a color key. Shadowing not only generates shadows between objects, but also affects the color of objects depending on their orientation with respect to the light source.
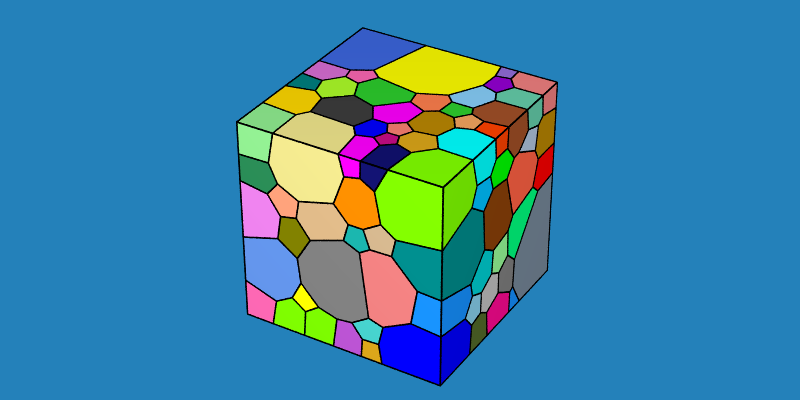
The background color of the scene can be specified using option -scenebackground (see Colors):
$ neper -V n200.tess -scenebackground 41:128:185 -print img26
Finally, the image size (in pixels) can be specified using option -imagesize:
$ neper -V n200.tess -imagesize 200:100 -scenebackground 41:128:185 -print img27
