Plotting an Orientation Color Key
The Visualization Module (-V) can color cells, elements, etc. according to their orientations, but an image of the color key itself is not generated. Color keys can be obtained as described in the following.
Note
People interested in a color key rather than how it is generated may simply copy the image.
Rodrigues Color Key
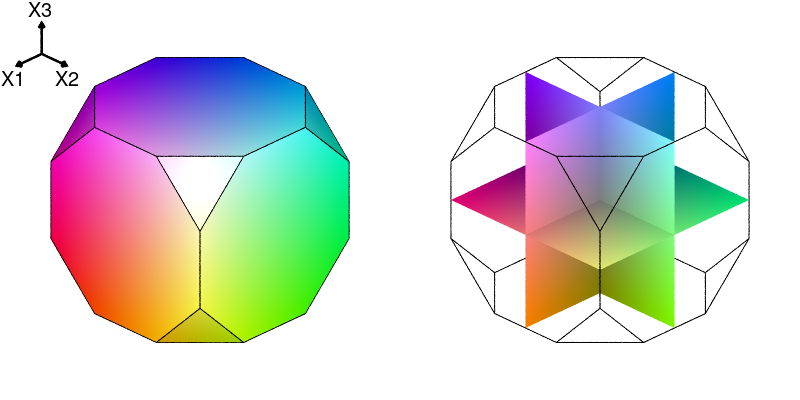
Cubic crystal symmetry is assumed. The color map onto the fundamental region of Rodrigues space is created by generating a tessellation corresponding to the fundamental region, meshing it, getting the node colors, and visualizing it - as the space is 3D, we also produce a slice view:
$ neper -T -n 1 -domain "rodrigues(cubic)" -o rodrigues
$ neper -M rodrigues.tess -cl 0.05 -statnode col_rodrigues
$ neper -V rodrigues.tess,rodrigues.msh -datanodecol "col:file(rodrigues.stnode)" -dataeltcol from_nodes -dataelt3dedgerad 0 -dataelt1drad 0.002 -showelt1d all -showcsys 1 -datacsyscoo 0.44:-0.44:0.65 -datacsysrad 0.005 -datacsyslength 0.15 -datacsyslabel " : : " -cameracoo 4:4:3 -imagesize 400:400 -cameraangle 14 -cameraprojection orthographic -sceneshadow 0 -print tmp1 -slicemesh "x=0,y=0,z=0" -showtess 1 -showcell 0 -showedge all -dataedgerad 0.002 -showmesh 0 -showmeshslice 1 -showcsys 0 -print tmp2
$ convert -pointsize 20 -draw "text 1,86 'X1' text 55,86 'X2' text 28,17 'X3'" tmp1.png tmp1b.png
$ convert +append tmp1b.png tmp2.png rodrigues.png

IPF Color Key
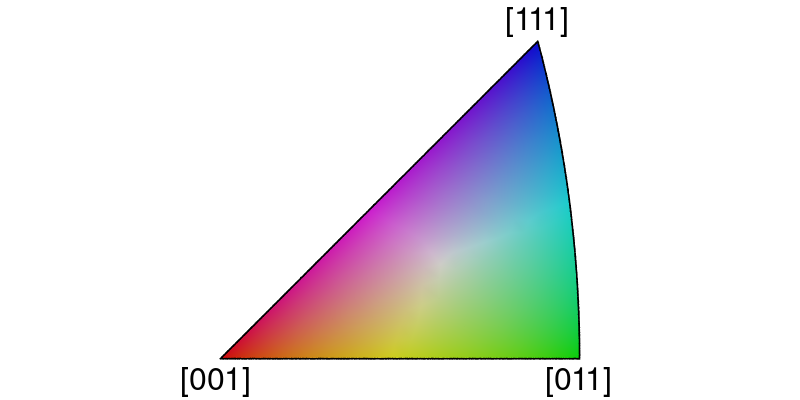
The color map onto the standard stereographical triangle (cubic crystal symmetry) is created by generating a tessellation corresponding to the triangle, meshing it, getting the node colors, and visualizing it:
$ neper -T -n 1 -domain stdtriangle -dim 2 -o stdtriangle
$ neper -M stdtriangle.tess -cl 0.02 -statnode col_stdtriangle
$ neper -V stdtriangle.msh -datanodecol "col:file(stdtriangle.stnode)" -dataeltcol from_nodes -dataelt2dedgerad 0 -dataelt1drad 0.001 -showelt1d all -imagesize 800:400 -print tmp
$ convert -pointsize 32 -draw "text 180,390 '[001]' text 545,390 '[011]' text 505,30 '[111]'" tmp.png stdtriangle.png

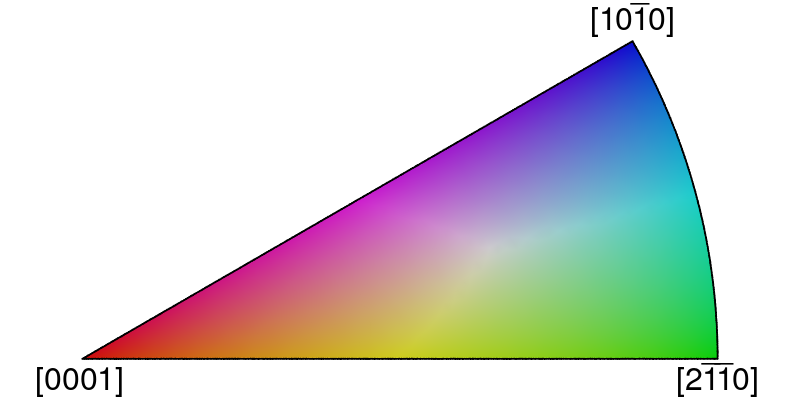
A color map for hexagonal crystal symmetry can be generated using the crysym optional argument:
$ neper -T -n 1 -domain "stdtriangle(crysym=hexagonal)" -dim 2 -o stdtriangleh
$ neper -M stdtriangleh.tess -cl 0.02 -statnode col_stdtriangle_hexagonal
$ neper -V stdtriangleh.msh -datanodecol "col:file(stdtriangleh.stnode)" -dataeltcol from_nodes -dataelt2dedgerad 0 -dataelt1drad 0.0015 -showelt1d all -cameracoo x:y:2.84 -imagesize 800:400 -print tmp
$ convert -pointsize 32 -draw "text 35,390 '[0001]' text 702,359 '_' text 715,359 '_' text 676,390 '[2110]' text 590,30 '[1010]' text 631,-1 '_'" tmp.png stdtriangleh.png
